
“Despite continued macroeconomic uncertainty and global geopolitical instability, the patent marketplace demonstrated sustained liquidity and increasing strategic activity—particularly among high-tech firms seeking to monetize intellectual property,” wrote AST in its Q1 2025 findings.
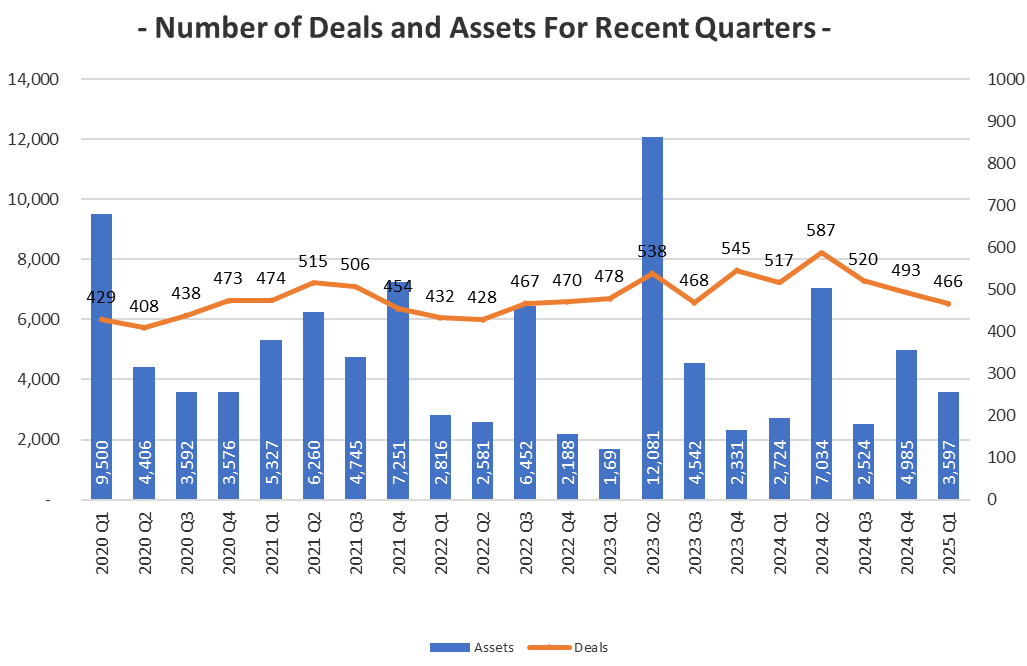
Compared to Q4 2024, the number of deals declined 5% from 493 to 466, while asset volume dropped 3% from 3,700 to 3,597. NPE activity surged, accounting for 48% of acquired assets, AST reports.
Patent deals and assets by quarter, 2020– 2025
 Source: AST
This chart visualises the quarterly trend in patent sale transactions and asset volumes over the past five years, highlighting the fluctuations and growth in the secondary patent market. AST warns that there are reporting lags at the US Patent and Trademark Office that will cause the Q1 2025 numbers to increase. Indeed, it has adjusted its Q4 2024 numbers upward to count late-reported transactions: the total deal number went up to 493.
AST says technology companies, pressured by interest rates and market volatility, are turning to IP monetisation through sales, licensing and litigation. The report measured an uptick in the share of assets that non-practicing entities bought: from 30% in Q4 2024 to 48% in Q1 2025. Seven of the deals led to 21 litigations against 20 big companies like Amazon, Comcast and ASUSTeK Computer. The report notes: “This quarter’s activity reflects a maturing secondary market where traditional operating companies and emerging NPEs are both aggressively acquiring and leveraging IP assets.”
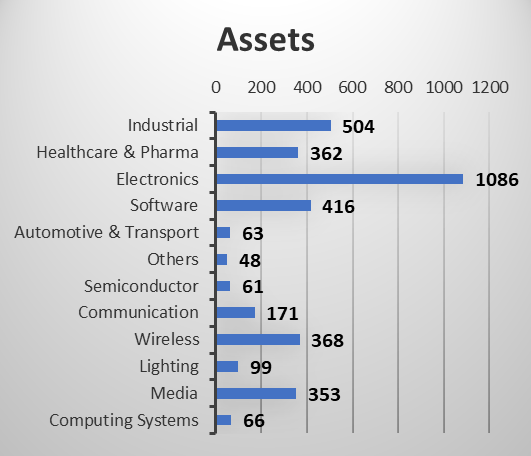
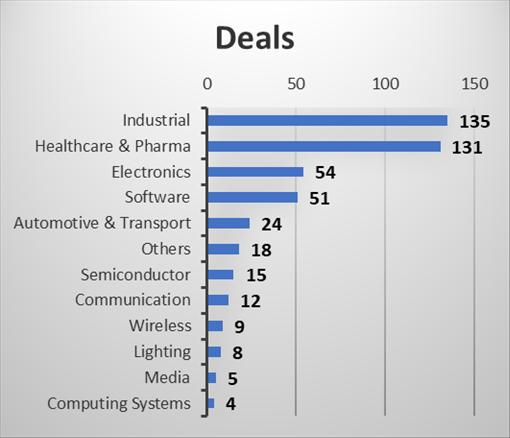
Industry category breakdown
Electronics led in asset volume (30%), followed by industrial (14%) and software (12%) sectors.
Source: AST
These bar charts illustrate the distribution of patent transactions by industry, both in terms of assets and deals for Q1 2025.
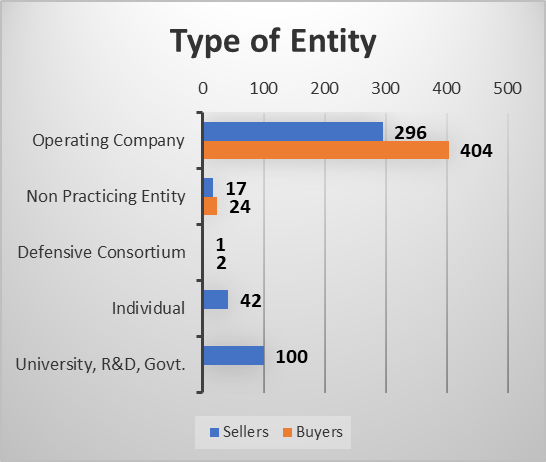
Seller and buyer breakdown
Operating companies dominated the market with 296 sellers and 397 buyers. Universities and R&D institutions were sellers in 111 deals. Software companies like Edigo, IBM and others sold 480 assets, while electronics firms such as Dolby, Panasonic, Philips, Samsung, Sony, Xiaomi and more acquired 270 assets. Non-practicing entities accounted for 17 sellers and 33 buyers.
 Source: AST
The above bar chart compares the number of sellers and buyers in Q1 2025, segmented by entity type.
Most of the operating companies that bought patent assets in the period were in the healthcare and pharma field, followed by Industrial and then electronics, as shown below.
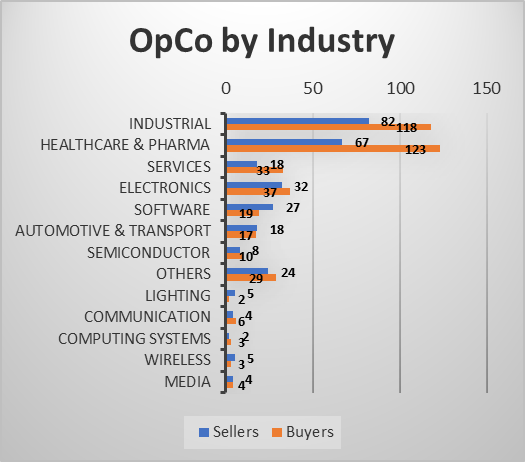
Source: AST
Top transactions
Dominion Harbor acquired 768 electronics patents from Dolby, while InterDigital purchased 328 media assets from Edgio. Ofinno Technologies sold 266 wireless assets to Dominion Harbor. LG Chem, Netgear and others also completed significant deals.
| Rank | Seller | Buyer | Assets | Industry |
|---|---|---|---|---|
| 1 | Dolby | Dominion Harbor | 768 | Electronics |
| 2 | Edgio | InterDigital | 328 | Media |
| 3 | Ofinno Technologies | Dominion Harbor | 266 | Wireless |
| 4 | LG | Xinmei Fontana Holding (Hong Kong) | 200 | Industrial |
| 5 | Netgear | Estelgia | 81 | Wireless |
Source: AST
AST also highlighted some smaller transactions because they may indicate an operating company is changing its technology focus or that an NPE could pose litigation risk. For example, NXP Semiconductors sold 24 computing assets to Anjay Venture Partners, an NPE that sued Texas Instruments in late Febraury. Xris sold 20 media assets to Philips; and OSRAM sold 18 electronics assets to Samsung, the report says.
According to the report, 296 operating companies sold 2,802 assets in 305 deals, which “reflects continued efforts by operating companies to monetize and strategically prune their portfolios”, AST writes. There were also 17 NPEs that sold 488 assets in 18 deals. Universities were involved in 111 deals (which is 24% of total transactions. Former university assets appeared in litigations against Fortinet and CrowdStrike Holdings.
“Notably, 4 of the top 11 sellers were academic institutions, underscoring their increasingly strategic role in the IP market,” AST notes.
Top sellers by number of deals
| Rank | Seller | Deals | Assets | Industry |
| 1 | Chinese Academy of Sciences | 5 | 7 | Semiconductor, industrial, healthcare and pharma |
| 2 | University of Oxford | 3 | 35 | Semiconductor, industrial, healthcare and pharma |
| 3 | Sumitomo Corp | 3 | 34 | Semiconductor, industrial |
| 4 | Netherlands Organisation for Applied Scientific Research | 3 | 3 | Semiconductor, industrial |
| 5 | Ofinno Technologies | 2 | 267 | Software, wireless |
Source: AST
When ranking buyers by the number of deals, NPE Jeffrey M Gross led with six deals, followed by Samsung and Allied Security Trust with five each. NPEs like Dominion Harbor and InterDigital secured over 1,300 assets collectively.
Buyers by number of deals
| Rank | Buyer | Deals | Assets | Industry |
| 1 | Jeffrey M Gross | 6 | 93 | Software, automotive, communications |
| 2 | Samsung | 5 | 50 | Software, electronics, industrial, healthcare and pharma, lighting |
| 3 | Allied Security Trust | 5 | 16 | Software, electronics, communications, semiconductors |
| 4 | Dedaleb IP Holdings | 4 | 9 | Software, electronics, other |
| 5 | Volkswagen | 4 | 4 | Automotive |
Source: AST
AST also found it noteworthy that Philips acquired 55 assets in two deals from Intellectual Discovery and Xris. Also, STMicroelectronics bought two electronics assets in two deals from Polytechnic University of Turin and the University of Pavia.
Methodology
AST monitors USPTO patent assignment records and gathers data from numerous public sources. US assets are reassigned numerous times between multiple parties for different purposes. Such assignment activity is monitored using proprietary methodology and each assignment record is probed for business intelligence, including the involved parties, business types, industries and technologies.
AST defines a “patent deal” as an exchange of assets (including patents and published applications) between the same parties during a set timeframe. Each deal may include multiple assets and multiple reel and frame numbers.
For the Q1 2025 study, AST analysed 34,934 USPTO assignments, involving 90,625 US assets with 815 sale assignments, recorded from 1 January to 31 March.